Businesses often invest significant resources into social media marketing, hoping to reach the right audiences and improve sales outcomes. One of the key considerations is demographics: who’s using which platforms, at what frequency, and for what purpose. Understanding social media demographics can shape content creation, platform selection, advertising strategies, and ultimately your ability to drive conversions and achieve a positive return on investment (ROI).
However, demographics are not always a definitive solution. Age, gender, and other demographic factors may help you pick the initial social media platforms to focus on—Instagram for a younger audience or LinkedIn for a professional crowd—but these categories never tell the full story. People’s behaviors, interests, and purchasing motives are multifaceted and can’t always be captured by demographic labels alone.
One complexity is the nature of targeting within these platforms. Social networks profit when you pay for visibility, and your organic reach may be limited. When you rely solely on demographic targeting and social media advertising platforms, you risk constantly paying to keep your brand visible. More importantly, you only access your audience through a rented channel. The algorithm changes, or policy shifts of a social platform can alter how many people see your posts—if they see them at all.
Conversions and ROI measurement also become tricky. You can see which demographics responded best to your ads, but that doesn’t necessarily translate to loyal customers or long-term sales. The ultimate goal is to build direct relationships with your audience—ones you own. While demographics can guide you to where your potential customers might be, relying solely on them could lead to superficial connections rather than meaningful engagement.
Building Direct Lines of Communication
The best way to overcome these pay-to-play pitfalls is to use social media as a starting point for relationship-building. Always strive to convert followers or social media visitors into email subscribers or SMS contacts. By obtaining an email address or phone number, you create a direct communication channel that doesn’t require constant ad spend for continued visibility. Instead of being subject to platform algorithms, you can reach out to your leads and customers on your terms and timing.
With direct access, you can nurture leads at a more personalized level, segmenting by purchase behavior, browsing history, or expressed interest rather than just age and gender. This allows you to cultivate a more meaningful, loyal relationship with your audience and ultimately improve conversion rates and ROI.
Keep that in mind as you review this latest data from Pew Research.
Table of Contents
These tables quickly reference demographic usage patterns across major social platforms. You can use them as a guide, but remember to focus on building direct customer relationships beyond demographic labels.
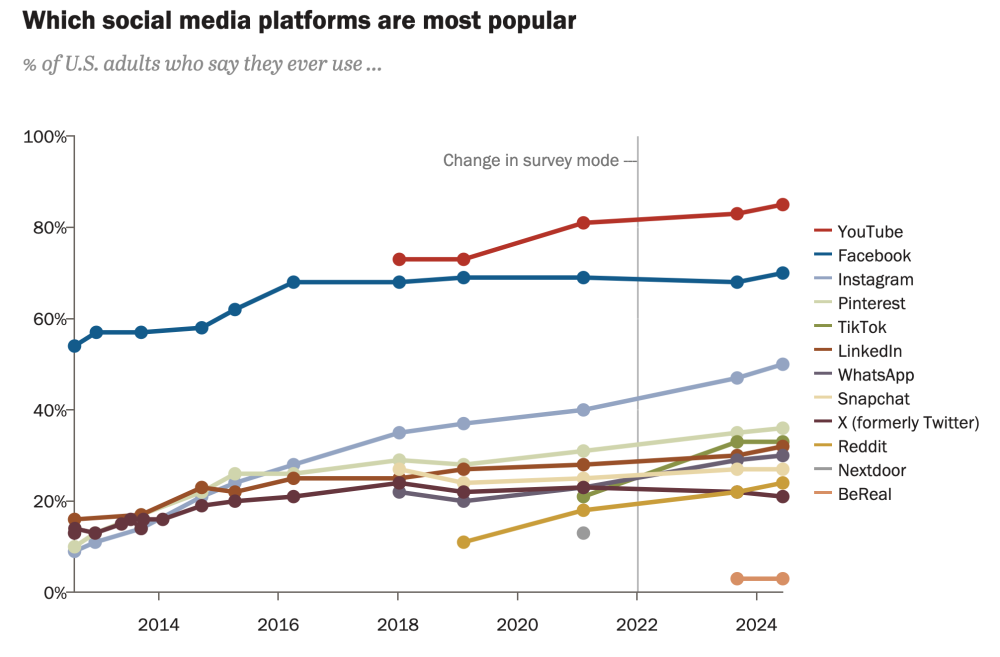
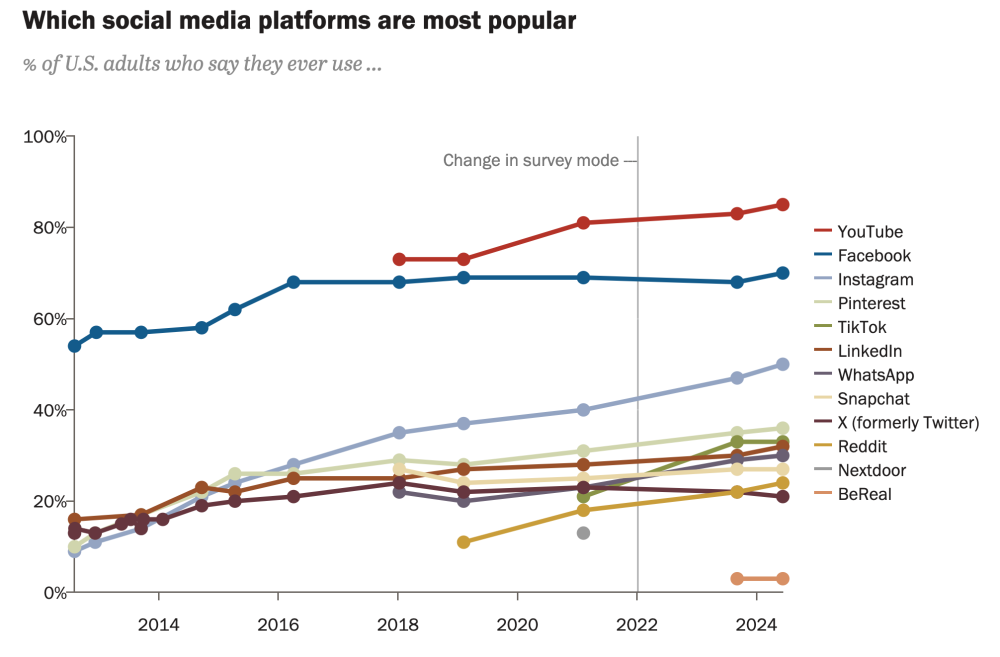
Which Social Media Platforms Are The Most Popular?
Americans’ preferences continue to evolve in a changing digital landscape with growing adoption across social media in the last decade.

Age Demographics and Social Media
| Platform | Ages 18-29 | Ages 30-49 | Ages 50-64 | 65+ |
|---|---|---|---|---|
| 68% | 78% | 70% | 59% | |
| 76% | 66% | 36% | 19% | |
| 40% | 41% | 30% | 15% | |
| X (formerly Twitter) | 38% | 25% | 15% | 8% |
| 43% | 43% | 33% | 22% | |
| Snapchat | 65% | 32% | 14% | 4% |
| YouTube | 93% | 94% | 86% | 65% |
| 30% | 40% | 28% | 18% | |
| 46% | 35% | 11% | 4% | |
| TikTok | 59% | 40% | 26% | 10% |
| BeReal | 10% | 2% | 1% | <1% |
Gender Demographics and Social Media
| Platform | Men | Women |
|---|---|---|
| 61% | 78% | |
| 44% | 55% | |
| 35% | 30% | |
| X (formerly Twitter) | 25% | 17% |
| 19% | 51% | |
| Snapchat | 23% | 31% |
| YouTube | 87% | 83% |
| 28% | 32% | |
| 28% | 20% | |
| TikTok | 26% | 39% |
| BeReal | 2% | 3% |
Race & Ethnicity Demographics and Social Media
| Platform | White | Black | Hispanic | Asian* |
|---|---|---|---|---|
| 70% | 73% | 69% | 65% | |
| 45% | 52% | 59% | 62% | |
| 33% | 34% | 24% | 50% | |
| X (formerly Twitter) | 19% | 24% | 22% | 26% |
| 37% | 36% | 35% | 25% | |
| Snapchat | 25% | 28% | 33% | 26% |
| YouTube | 82% | 88% | 89% | 93% |
| 22% | 36% | 56% | 39% | |
| 24% | 18% | 22% | 42% | |
| TikTok | 26% | 50% | 48% | 31% |
| BeReal | 3% | 2% | 2% | 5% |
*Estimates for Asian adults are representative of English speakers only. White, Black, and Asian adults include those who report being only one race and are not Hispanic. Hispanics are of any race.
Household Income Demographics and Social Media
| Platform | Less than $30,000 | $30,000 to $69,999 | $70,000 to $99,999 | $100,000+ |
|---|---|---|---|---|
| 65% | 73% | 73% | 70% | |
| 41% | 47% | 54% | 58% | |
| 16% | 22% | 34% | 53% | |
| X (formerly Twitter) | 15% | 18% | 24% | 27% |
| 29% | 34% | 39% | 40% | |
| Snapchat | 28% | 32% | 26% | 24% |
| YouTube | 78% | 84% | 87% | 90% |
| 26% | 26% | 30% | 37% | |
| 15% | 22% | 22% | 34% | |
| TikTok | 37% | 39% | 36% | 26% |
| BeReal | 3% | 2% | 3% | 3% |
Education Demographics and Social Media
| Platform | High school or less | Some college | College graduate+ |
|---|---|---|---|
| 69% | 71% | 70% | |
| 41% | 51% | 57% | |
| 12% | 31% | 54% | |
| X (formerly Twitter) | 13% | 23% | 27% |
| 29% | 41% | 39% | |
| Snapchat | 28% | 32% | 22% |
| YouTube | 79% | 87% | 90% |
| 23% | 25% | 42% | |
| 14% | 27% | 32% | |
| TikTok | 37% | 37% | 26% |
| BeReal | 2% | 4% | 3% |
Community Demographics and Social Media
| Platform | Urban | Suburban | Rural |
|---|---|---|---|
| 67% | 70% | 74% | |
| 51% | 54% | 39% | |
| 32% | 39% | 19% | |
| X (formerly Twitter) | 22% | 23% | 15% |
| 31% | 37% | 39% | |
| Snapchat | 25% | 27% | 30% |
| YouTube | 85% | 87% | 81% |
| 39% | 31% | 19% | |
| 24% | 29% | 14% | |
| TikTok | 36% | 31% | 33% |
| BeReal | 3% | 3% | 2% |
By combining an understanding of demographics with a strategy focused on direct nurturing, you can more effectively leverage social media for long-term business growth and improved sales performance.


